next up previous
Next: D. Character of the Up: WKB Metastable States Previous: B..2 Evaluation of the


C. General analysis for signs on a bounded trajectory

The ``graphical'' analysis of the classical dynamics performed in section 3 is based on the plot of figure 5. In the discussion a relevant point is the sign of $\bar{\sigma} _{\mathrm{in}}$ and $\bar{\sigma} _{\mathrm{out}}$, which is crucial in determining the direction of the normal to the shell pointing in the direction of increasing radius as well as the side of the Penrose diagram crossed by the trajectory. We will show here that the situation analyzed for the particular value $\Theta = 0.55$ is, in fact, general. The sign of $\bar{\sigma} _{\mathrm{in}}$ is given (18), so that we see that is positive for
\begin{displaymath}
x < x _{\sigma _{\mathrm{in}}} ( \Theta ) \equiv ( 2 \Theta ) ^{1/3}
.
\end{displaymath}

More complicate is the analysis of the sign of $\bar{\sigma} _{\mathrm{out}}$, because from (19) we see that it is determined as the sign of a polynomial of order four. It has at most two real roots for $\Theta < \Theta _{\mathrm{crit.}} / \sqrt{2} = (3/4) ^{3/2} / \sqrt{2}$; this can be seen also from the analysis of A. Indeed $\bar{\sigma} _{out} > 0$ if

\begin{displaymath}
x ^{4} - 2 a x + 2 a ^{2} < 0 \quad \mathrm{with} \quad a > 0
.
\end{displaymath}

The real roots of the left hand side of the above inequality can be deduced from those of the left hand side of (32) since

\begin{displaymath}
x ^{4} - 2 a x + 2 a ^{2}
\longrightarrow
\frac{1}{4}
\le...
...qrt{2}}
\quad \mathrm{and} \quad
a \to \frac{a}{\sqrt{2}}
.
\end{displaymath}

Then, if we call $x _{\sigma _{\mathrm{out}}} ^{(-)}$ and $x _{\sigma _{\mathrm{out}}} ^{(+)}$ the two real values for which $\bar{\sigma} _{\mathrm{out}}$ changes sign, we see, using the transformation above, that we must have $a \leq (3/4) ^{3/2} / \sqrt{2}$ and that
\begin{displaymath}
x _{\sigma _{\mathrm{out}}} ^{(\mp)}
=
\frac{1}{2 \cdot 3 ...
...3 ^{1/3} b ^{2}}{{\mathcal{T}}} + {\mathcal{T}}}}
}
\right\}
\end{displaymath} (36)

with

\begin{displaymath}
{\mathcal{T}}
=
\sqrt[3]{18 b ^{2} + 2 \sqrt{81 b ^{4} - 384 b ^{6}}}
\end{displaymath}

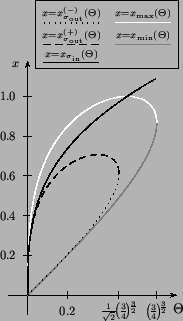
Since the above expressions are not very enlightening (and the same is true for those of (33), the easiest way to compare them with the turning points is again the graphical one, i.e. the plot of $x _{\sigma _{\mathrm{in}}} (\Theta)$, $x _{\sigma _{\mathrm{out}}} ^{(\pm)} (\Theta)$, $x _{\mathrm{min}} (\Theta)$, $x _{\mathrm{max}} (\Theta)$, which we can see in figure 14.
\includegraphics{fig20}
Figure 14: Graph of the curves that helps in determining the sign of $\sigma $'s for different values of the parameter $\Theta $. Since the classically allowed trajectories are delimited by the $x = 0$ axis and by the dark gray continuous curve $x = x _{\mathrm{min.}} (\Theta)$, we see that no changes of signs of $\sigma $'s occur along them.


For small $x$ (on the vertical axis) $\bar{\sigma} _{\mathrm{in}}$ is positive and $\bar{\sigma} _{\mathrm{out}}$ is negative. Since all the zeroes, when they exist, are bigger than the the turning point $x _{\mathrm{min}}$, which is the upper limit of the bounded trajectory, then there is no change of sign of $\sigma $'s along it.


next up previous
Next: D. Character of the Up: WKB Metastable States Previous: B..2 Evaluation of the

Stefano Ansoldi